RASOR has been used to demonstrate its usefulness in the evaluation of impacts deriving from extreme natural phenomena such as floods, earthquakes, hurricanes. In particular, flood hazard was chosen as examples to show the possible applications of the platform in support of the RO activities.
The analysis focused on the south-west part of the island of Haiti, in the Grand'Anse area where satellite acquisitions were also concentrated which allowed the application of the Change Detection algorithm for calculating the transition classes of land use.
The analysis developed following the following steps:
• Data collection
• The characterization of the Hazard
• The modelling of the exposed elements
• The vulnerability analysis
• The calculation of impacts
• The return of the results
Data collection
Data collection took place through three main data sources:
• Some open data platforms
• Research of official literature
• Data collected or produced by other actors
In the first category, different sources of data were considered. First of all, the Open StreetMap platform from which it is possible to derive the footprints of the main buildings and their intended use as well as the position of most points of interest in the geographical area in questions. In addition to the OSM platform, reference was made to the Geo-spatial catalog Geonode of Haiti - Haitidata.org which collects information layers produced by various Haitian institutions also in collaboration with international partners. Much of the data produced by the RO are located in this platform. Specifically, the population referred to the "High Resolution Settlement Layer (CIESIN), 2016" derived mainly from satellite sources.
As regards the sources of data from official literature, various reports were consulted describing the damage suffered in the area of interest as a result of specific events. In particular, the following reports were consulted:
- MDEF (2016), Évaluation rapide des dommages et des pertes occasionnés par l’ouragan Matthew et éléments pour la reconstruction;
- UNDP (2016), Évaluation des besoins post cyclone dans le secteur logement;
- UNDP – MPCE (2017), Cartographie multirisque du département de la Grand ’anse Haïti
To define the hazard, previous studies developed by various bodies were used as references, in particular the Global Assessment Report (2015) as regards the flood hazard maps and the NOAA study (2017) for the cartography of Hurricane Matthew.
Flood analysis
In the case of the flood, the hazard maps for different return times were selected from two different studies: the GAR 2015 corrected with the perimeters of a study collected by the CNIGS (2010) and the study carried out by UNDP MPCE (2017).
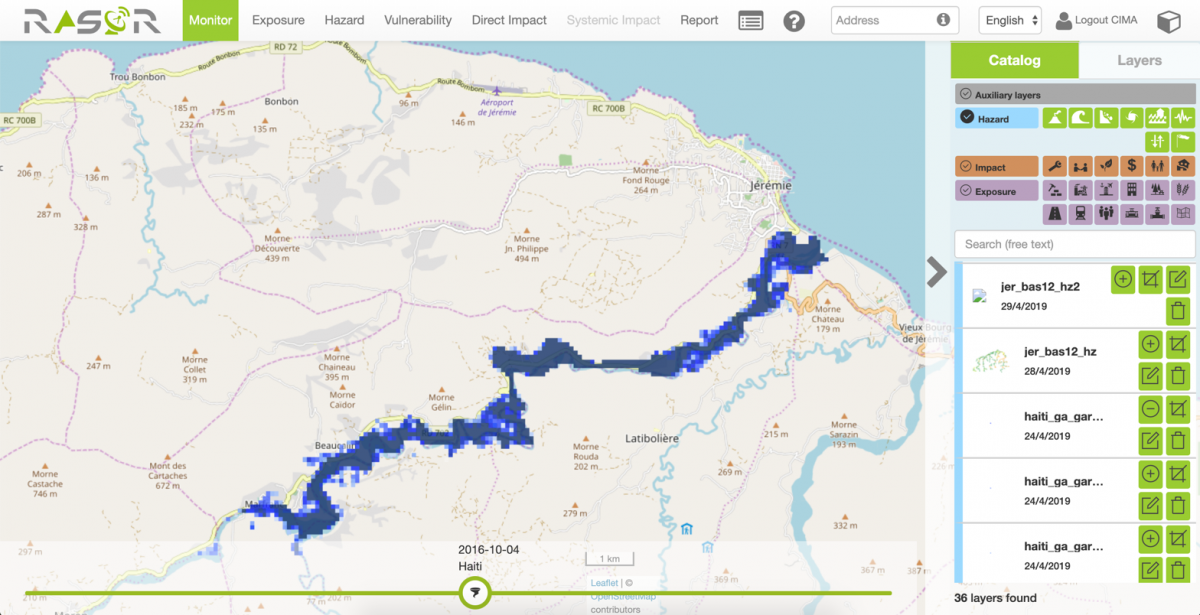
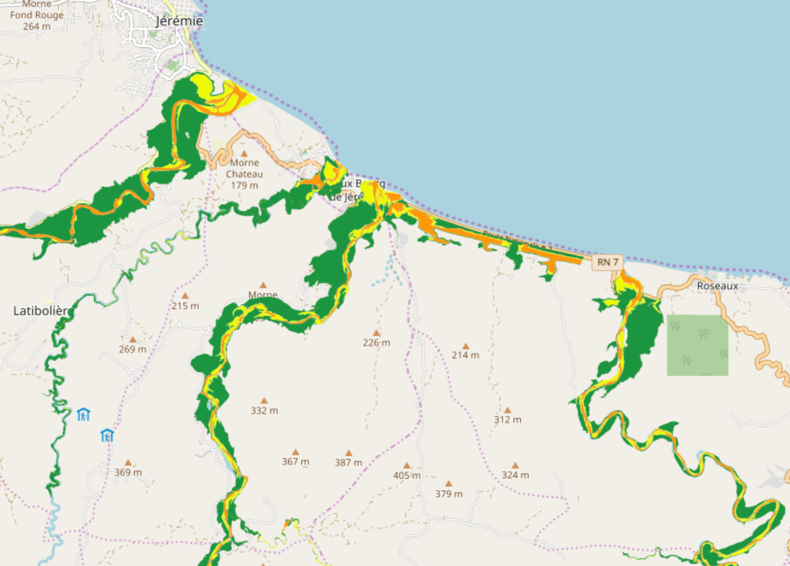
Figura 1 flood maps deriving from GAR 2015, maps deriving from the CNIGS 2010 study - hazard maps Return time 50 years, in line with the ground effects caused by hurricane Matthew in the Grand'Anse area.
Modelling of exposed elements
Through the RASOR platform, the exposed elements were modelled on the basis of their fundamental characteristics to define their vulnerability in relation to the hazard selected.
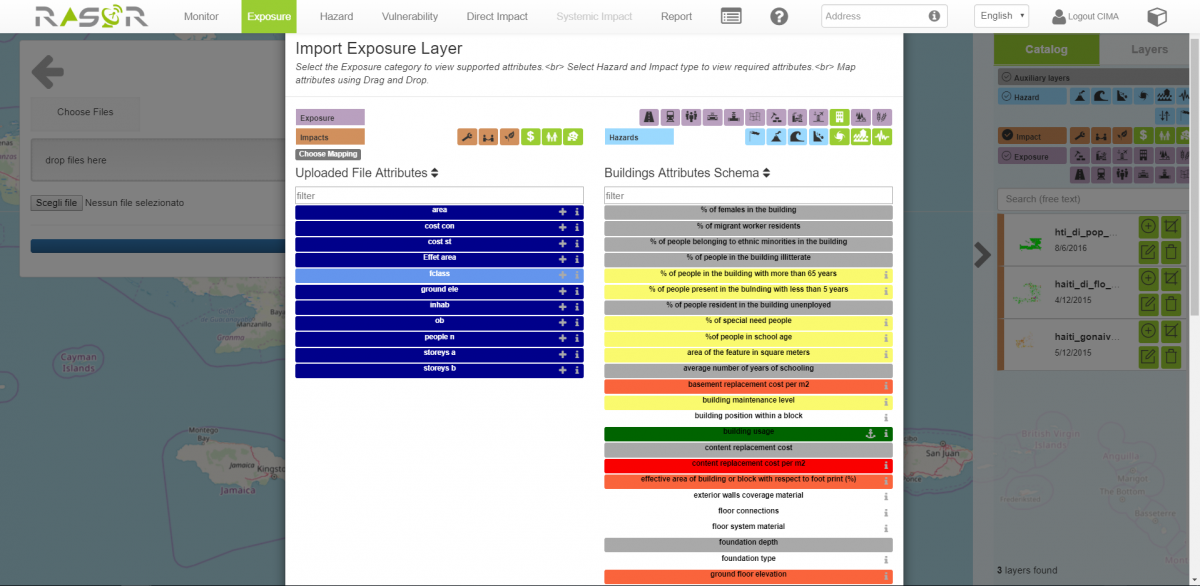
Figura 4 characterization of the exposure elements developed by RASOR platform.
Vulnerability assessment
Vulnerability is determined in quantitative terms starting from the selection of appropriate vulnerability functions that link the magnitude / severity of the events to the percentage damage suffered by the individual elements exposed.
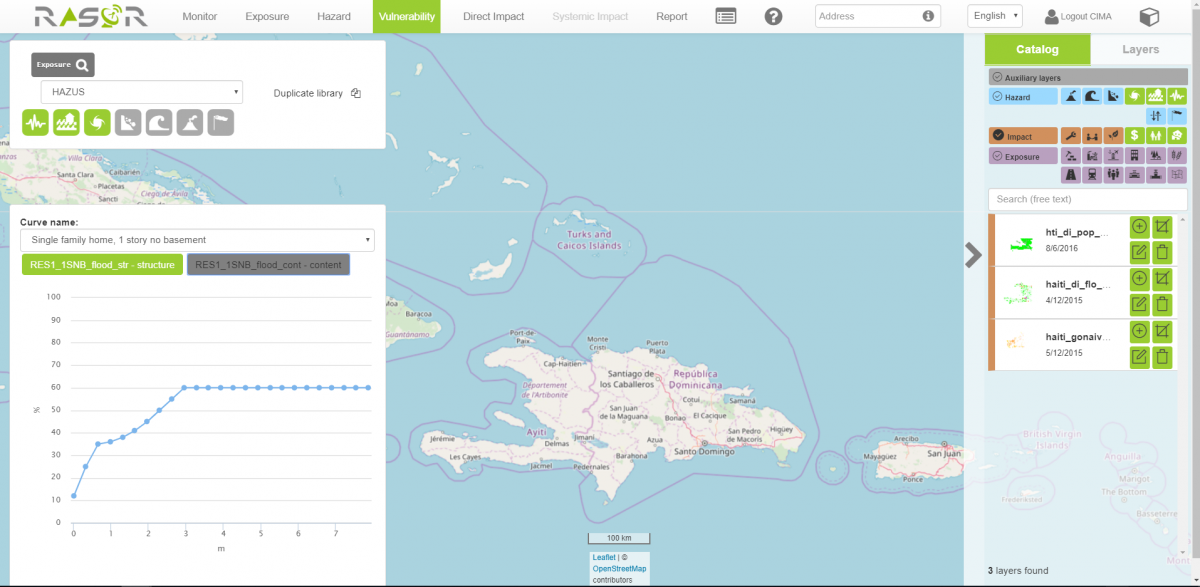
Figura 5 characterization of the vulnerability developed by RASOR platform, the curves selected concern floods, earthquakes and wind damage caused by hurricanes.
Calculation of impacts
Starting from the combination of hazard vulnerability and the value of the exposure, the impacts were calculated which tended to demonstrate the usefulness of a calculation platform of this type in creating value-added information starting from results created by other projects in the country. An example of a result is given in the figure where economic losses can be disaggregated between the different intended uses of the buildings and structures exposed. The results can be easily mapped on Sendai indicators, in particular B1, C1 and the breakdown of C1 in consideration of the categories of use of the exposed as available from the collected data. Both the table and the pie chart shown in Figure 6 give an idea of the disaggregation of the data that can be achieved. This information is an immediate support after catastrophic events and can be used to guide the rescue and reconstruction phases and to plan the recovery phase in full.
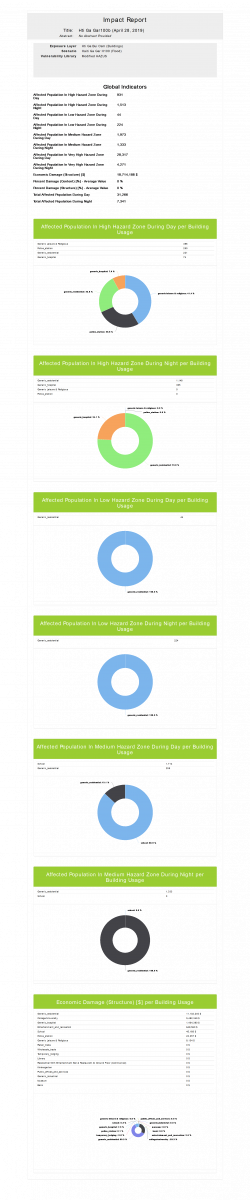
Figura 6 Impact calculation developed by the RASOR flood platform of the Grand’Anse area